A mid-market e-commerce brand was stuck. Their Shopify store was generating less than $60 in weekly revenue from a single conversion. Product pages were thin, structured data was missing, and Google Ads were running on autopilot with no Performance Max strategy.
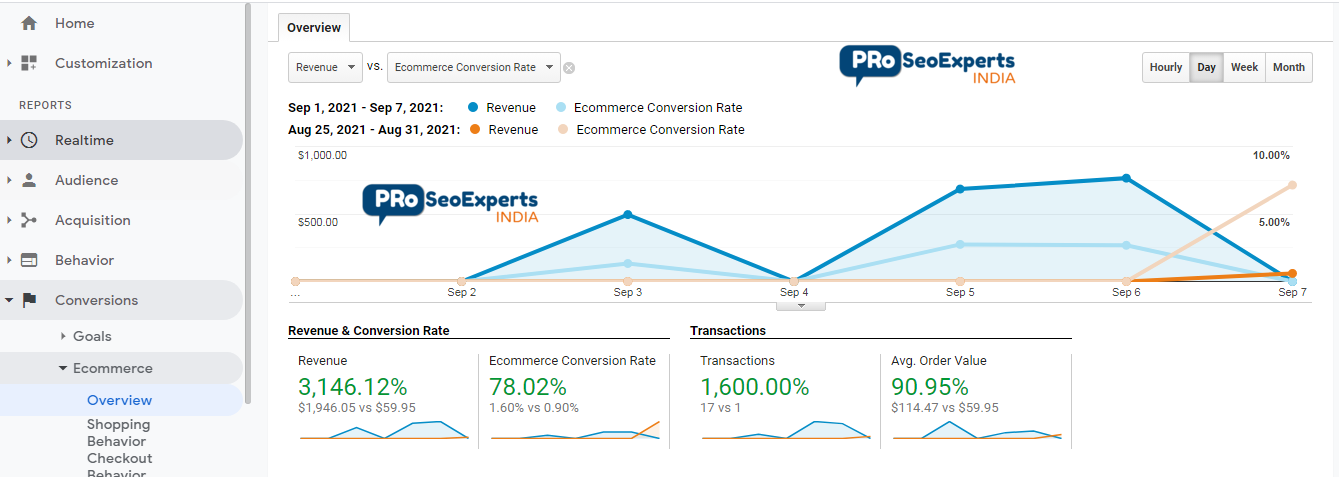 Google Analytics — Weekly Revenue +3,146.12%, Transactions +1,600%, Avg. Order Value +90.95%. Sep 1–7 vs Aug 25–31, 2021.
After the initial spike, we doubled down. Month-over-month revenue continued to compound — another +281% on top of the breakout week, with average order value climbing from $46.47 to $112.29.
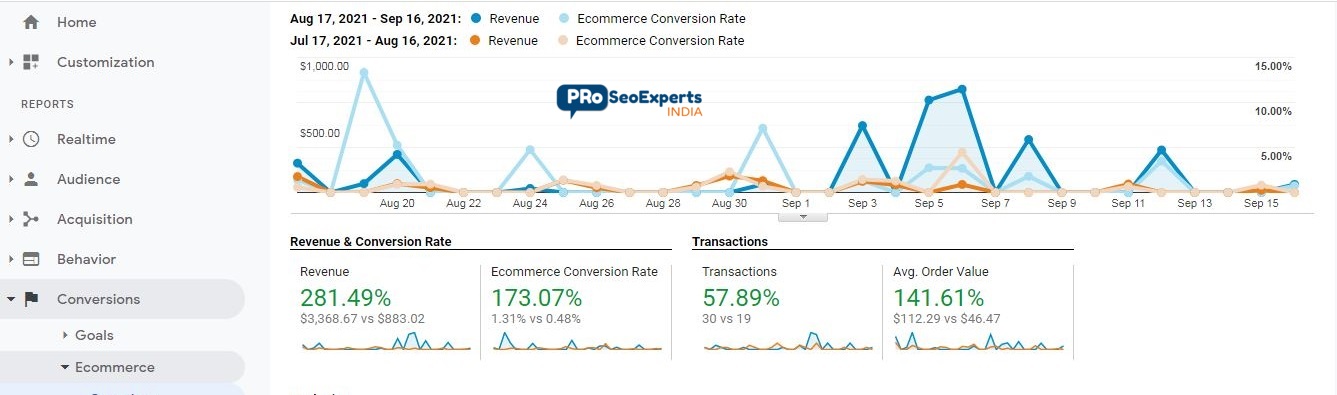 Google Analytics — Month-over-month: Revenue +281.49%, Conversion Rate +173.07%, AOV +141.61%, Transactions +57.89%. Aug 17–Sep 16 vs Jul 17– Aug 16, 2021.
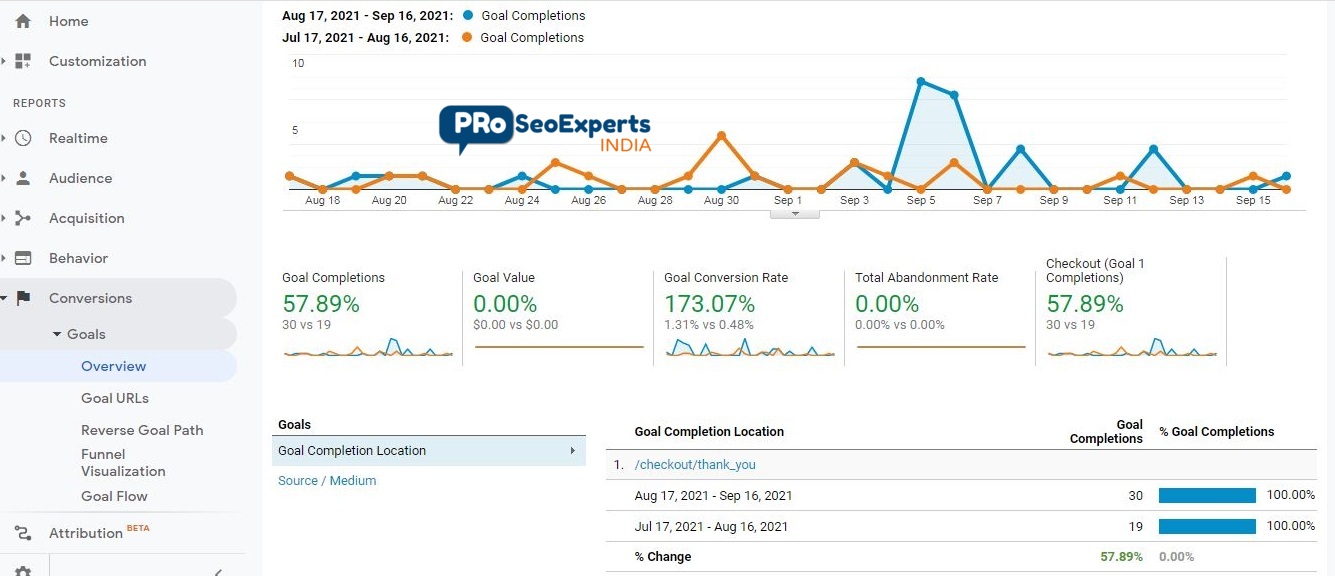 Google Analytics — Goals Completions +57.89%, Conversion Rate +173.07%, Checkout Goal Completions +57.87%. Aug 17–Sep 16 vs Jul 17– Aug 16, 2021.
The biggest achievement came after three months of continuous optimization. Revenue increased by 150.95%, growing from $3,764.52 to $9,447.09. Instead of relying on temporary growth, the business established a consistent upward trend in both revenue and transactions.
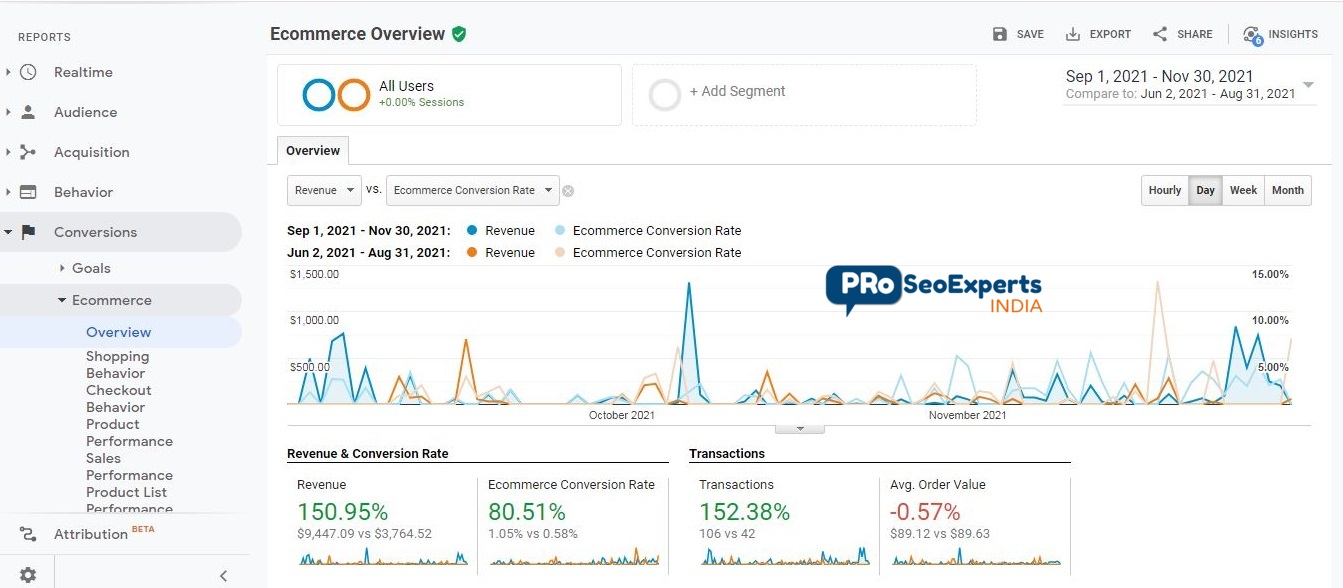 Google Analytics — 90 Days Revenue +150.95%%, Transactions +152.38%, Avg. Order Value -0.57%. Sep 1– Nov 30 vs Jun 2–Aug 31, 2021.
None of this required black-hat tactics, paid manipulation or short-term hacks. It came from disciplined execution of fundamentals — schema, architecture, content, and a focused ad spend. The same playbook is repeatable for any e-commerce or lead-gen brand willing to do the work.